Queanbeyan Flood Level History
A Work In Progress Awaiting Additional Data
| Queanbeyan Flood Level History |
| Year |
Date |
Peak (m) |
|
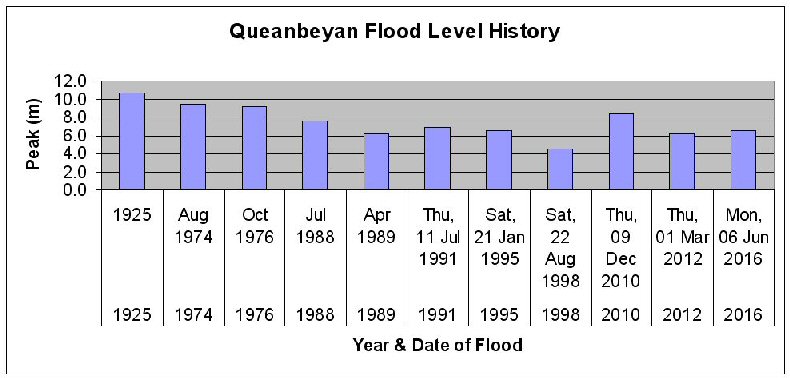
| 1925 |
1925 |
10.7 |
(Approx) |
| 1974 |
Aug 1974 |
9.5 |
|
| 1976 |
Oct 1976 |
9.2 |
(Approx) |
| 1988 |
Jul 1988 |
7.6 |
|
| 1989 |
Apr 1989 |
6.2 |
|
| 1991 |
Thu, 11 Jul 1991 |
6.9 |
|
| 1995 |
Sat, 21 Jan 1991 |
6.5 |
(Approx) |
| 1998 |
Sat, 22 Aug 1998 |
4.5 |
(Approx) |
| 2010 |
Thu, 09 Dec 2010 |
8.4 |
|
| 2012 |
Thu, 01 Mar 2012 |
6.2 |
(Approx) |
| 2016 |
Mon, 06 Jun 2016 |
6.6 |
(Approx) |
Bar Chart of Queanbeyan Flood Levels over the Years
Source of data to date, and as at Thu, 20 Jan 2011, has been the City Infrastructure Unit of the Queanbeyan City Council.
I wish to acknowledge them and thank them for their assistance in this matter. They have also provided the following information:
- The height is usually related to a particular location and refers to the depth of water at that location
- For Queanbeyan, it is the water depth gauge under the Queens Bridge on Monaro St over the Queanbeyan River
- Sometimes the levels are related to Australian Height Datum and expressed as a height above sea level, but this is infrequent
I would also like to acknowledge the assistance of Matthew Saxby for corrections and additions to the data as well as providing
the data for the most recent event on Thu, 01 Mar 2012.
Note: Data for flood of Mon, 06 Jun 2016 taken from BoM data from their station "Queanbeyan R at ACT Border".
If anyone can provide any additional information as to the actual date of any of the above events to complete the above
data this would be much appreciated. Thanks. My email address is accessible below.
The table on this page was generated from an Excel spreadsheet using the program LISTPICS and then modified
URL for this homepage: http://pmyers.pcug.org.au/General/QueanbeyanFloodLevelHistory.htm
Modifications to this page © 2012, Paul Myers
